How Normal Am I Score Explained: What Does Your Rating Actually Mean?
A plain-English breakdown of every score band, the science behind the algorithm, and why your number might surprise you.
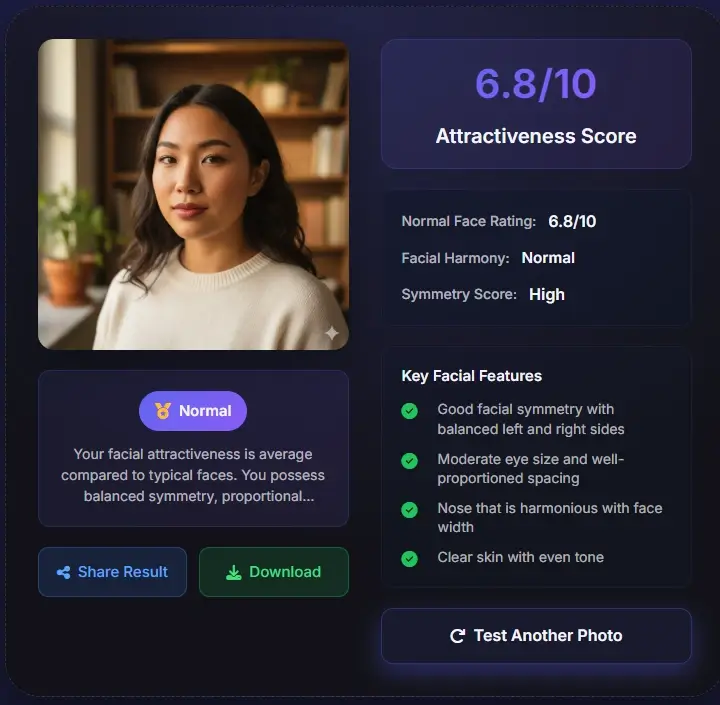
Table of Contents
- What Is the How Normal Am I Score?
- A Quick Reading Chart
- The 1–10 Scale: What Each Band Means
- Where Most People Actually Land
- How the AI Calculates Your Score
- Why Your Score Changes Between Photos
- Is a 5 a Bad Score? (The Bell Curve Truth)
- Common Mistakes When Reading Your Score
- How to Retest Before You Trust One Score
- Tips for a More Accurate Result
- What the Score Cannot Tell You
- FAQ
You uploaded a photo, waited a few seconds, and a number appeared on your screen. Maybe it was a 6.4. Maybe a 7.8. Maybe a 4.9 that left you staring at the ceiling wondering what went wrong.
Here's the thing: that number means something specific — and it almost certainly doesn't mean what you think it means. The How Normal Am I score is not a verdict on your worth, your attractiveness in real life, or how other people perceive you. It's a mathematical output from an AI model trained on facial geometry data. Once you understand the mechanics, the number becomes genuinely useful rather than anxiety-inducing.
I've spent years covering AI beauty tools, and the single most common mistake I see is people treating a 5 or 6 as a failure. It isn't. Let me show you why.
What Is the How Normal Am I Score?
The How Normal Am I score is a 1–10 rating generated by an AI model that analyzes your facial features against a large dataset of human faces. The algorithm measures dozens of geometric relationships — symmetry, proportions, feature spacing — and compares them to population averages.
The word "normal" in the tool's name is key. The score doesn't ask "are you beautiful by magazine standards?" It asks "how closely do your facial measurements align with the statistical average of human faces?" Faces that sit close to the population average tend to score in the 4–6 range. Faces with exceptional symmetry and proportions score higher.
Think of it like a bell curve. Most people cluster in the middle. Very few sit at either extreme. The score is a position on that curve — nothing more, nothing less.
The Core Idea
The score measures alignment with statistical facial norms, not your real-world attractiveness. Personality, confidence, expression, and presence — the things that actually make someone magnetic — are invisible to the algorithm.
A Quick Reading Chart for Your How Normal Am I Score
Before you compare yourself with a perfect-looking example online, use the score as a range. The same person can move up or down when lighting, expression, crop, or camera distance changes.
| Your result | Plain-English reading | What to check next |
|---|---|---|
| Below 4.5 | Often a sign that the photo or landmark detection needs review before you judge the face. | Retake with better light, less tilt, and no occlusion. |
| 4.5 to 5.9 | A normal or average-looking result, which is common and often visually balanced. | Read the average face guide before assuming average means bad. |
| 6.0 to 7.4 | A clearly above-average result for facial harmony in the uploaded photo. | Compare similar photos to see whether the band is stable. |
| 7.5 and above | An uncommon high score that often reflects strong symmetry, clear landmarks, and favorable photo conditions. | Use the result as a reference, not an identity. |
Use this chart as the first pass, then read the detailed score bands below. If one photo produces a surprising number, retest with two clear front-facing photos before changing how you feel about the result.
The 1–10 Scale: What Each Band Means
Here's a plain-English breakdown of every score range, what it typically indicates, and roughly how common it is.
Significant Deviation
Scores this low almost always reflect a photo problem rather than your actual face. Extreme angles, heavy shadows, partial occlusion (hair over the face, glasses), or very low image resolution can push the AI's landmark detection off-track. If you score here, try a new photo before drawing any conclusions.
Below Average
Features that deviate more noticeably from population averages — asymmetry, proportions outside typical ranges — or, again, suboptimal photo conditions. Worth retesting with better lighting and a straight-on angle.
Average — The Sweet Spot
This is where the majority of people land, and it's genuinely a good place to be. A score of 5 means your facial geometry closely matches the population average. Research in evolutionary psychology consistently shows that average faces are perceived as attractive and approachable — they're familiar to our brains in a way that feels pleasant.
Above Average
Strong facial harmony, good symmetry, and proportions that sit favorably relative to population norms. If you're in this range, your facial geometry is genuinely above the statistical midpoint. This is where most people who are commonly described as "good-looking" tend to land.
Highly Attractive
Exceptional symmetry and proportion coherence. Scores here are uncommon. People in this range often have features that are both balanced and distinctive — the combination that tends to read as striking rather than merely pleasant.
Exceptional
Extremely rare. Scores in this range indicate near-perfect alignment with every geometric metric the AI measures. In practice, even professional models and actors rarely score consistently in this band — partly because no photo is perfect, and partly because the algorithm is calibrated against a very large population.
How Normal Am I Score Reference Guide
| Score Range | Label | What It Means | Approx. % of Results |
|---|---|---|---|
| 9.0 – 10.0 | Exceptional | Near-perfect geometric alignment; extremely rare | 1–2% |
| 7.5 – 8.9 | Highly Attractive | Exceptional symmetry and proportion coherence | ~10% |
| 6.0 – 7.4 | Above Average | Strong facial harmony, above statistical midpoint | ~25% |
| 4.5 – 5.9 | Average | Close to population mean; the most common range | ~45% |
| 3.0 – 4.4 | Below Average | Notable deviation from norms, or photo quality issue | ~15% |
| 1.0 – 2.9 | Significant Deviation | Almost always a photo/detection problem | <5% |
Where Most People Actually Land
One of the most reassuring things I can tell you is this: the score distribution follows a bell curve, just like height, IQ, or almost any other human trait measured at scale.
The vast majority of scores — roughly 70% — fall between 4.5 and 7.4. Scores below 3 or above 9 are genuinely rare. If you're sitting at a 5.8 and feeling disappointed, you're actually in the statistical majority of human faces. That's not a consolation prize — it's the mathematical reality of how the scale works.
The chart below shows the approximate distribution based on aggregated results from AI attractiveness tools:
Approximate Score Distribution (Bell Curve)
Distribution is approximate and based on aggregated data from multiple AI facial analysis platforms.
How the AI Calculates Your Score
The score isn't a single measurement — it's a weighted combination of several distinct analyses. Understanding each one helps you interpret your result more accurately.
Facial Symmetry
~30%The AI maps corresponding points on the left and right sides of your face and calculates how closely they mirror each other. Research published in the journal Evolution and Human Behavior found that symmetry accounts for a meaningful portion of attractiveness ratings across cultures. Importantly, perfect symmetry (100%) can actually look slightly unnatural — most highly-rated faces score between 85–95% symmetry.
Facial Proportions & Golden Ratio
~25%The algorithm measures key ratios: face length to width, the vertical thirds (forehead / mid-face / lower face), eye width relative to face width, and nose width relative to face width. These are compared against population averages. The golden ratio (φ ≈ 1.618) is one reference point, though modern research suggests proximity to population averages matters more than any single mathematical ideal.
Eye Spacing & Size
~15%Interocular distance (the gap between your eyes) relative to face width is one of the most studied facial metrics. Research from the University of California found that an interocular distance of approximately 46% of face width is rated most favorably. Eye size relative to face size also contributes to this component.
Nose Proportions
~10%Nose width, length, and projection relative to the overall face. The AI compares these against population norms rather than any single "ideal" shape — what reads as harmonious varies across ethnicities and face shapes.
Lip Width & Harmony
~10%The ratio of lip width to face width, and the balance between upper and lower lip. A lower-to-upper lip ratio of approximately 1.5:1 to 2:1 is generally associated with higher attractiveness ratings in research studies.
Overall Facial Harmony
~10%A holistic assessment of how all features work together. This is where deep learning adds nuance beyond simple measurements — the model has been trained on millions of rated faces and can detect subtle patterns of harmony that don't reduce to any single ratio.
What the AI Measures (and Approximate Weight)
| Factor | What's Measured | Approx. Weight |
|---|---|---|
| Facial Symmetry | Left/right mirror alignment of facial landmarks | ~30% |
| Facial Proportions | Key ratios: face length/width, vertical thirds, golden ratio proximity | ~25% |
| Eye Spacing & Size | Interocular distance relative to face width; eye size | ~15% |
| Nose Proportions | Width, length, and projection vs. population norms | ~10% |
| Lip Width & Harmony | Lip-to-face ratio; upper/lower lip balance | ~10% |
| Overall Harmony | Holistic deep-learning assessment of feature interaction | ~10% |
Why Your Score Changes Between Photos
This is the question I get asked most often: "I took two photos five minutes apart and got completely different scores. Which one is real?"
Both are real — and neither is definitive. The AI is analyzing the photo, not your face in the abstract. Several variables can shift your score by a full point or more:
How Photo Conditions Affect Your Score
| Variable | Potential Score Impact | Best Practice |
|---|---|---|
| Lighting direction | ±0.8 – 1.5 points | Soft, diffused light from directly in front |
| Camera angle | ±0.5 – 1.2 points | Eye level, straight-on, head level |
| Facial expression | ±0.3 – 0.8 points | Neutral or very slight natural smile |
| Image resolution | ±0.2 – 0.6 points | Modern smartphone camera, good focus |
| Hair / glasses occlusion | ±0.5 – 1.5 points | Clear face, hair pulled back, no glasses |
The practical takeaway: if you want the most accurate reading, take multiple photos under consistent conditions and average the results. A single score from a single photo is a data point, not a verdict.
Is a 5 a Bad Score? (The Bell Curve Truth)
No. A 5 is not a bad score. I want to be direct about this because the cultural baggage around the number 5 — "just average," "mediocre," "nothing special" — is genuinely misleading in this context.
In the context of facial geometry, a score of 5 means your features closely match the statistical average of human faces. And here's what the research actually says about average faces: they're consistently rated as attractive.
A landmark study by Langlois and Roggman (1990) created composite faces by averaging multiple individual faces together. The result? The composite faces were rated as significantly more attractive than most of the individual faces that went into them. Average faces are familiar to our brains, easy to process, and perceived as pleasant and approachable.
A score of 5 or 6 doesn't mean you're unremarkable. It means your face sits in the zone that human brains are literally wired to find appealing.
Research Note
The "averageness" theory of attractiveness is one of the most replicated findings in facial attractiveness research. For a thorough overview, see the entry on physical attractiveness in academic literature, including the work of Judith Langlois whose cross-cultural studies demonstrated that average faces are consistently rated as attractive across different populations. Physical attractiveness - Wikipedia.
Related Guide
If the word average sounds confusing, read our average face meaning guide to understand why a normal face rating can still be a positive result.
Try a fresh photo
When you want a practical comparison, take the am I normal test with a clear front-facing photo and compare the result with the score bands above.
Common Mistakes When Reading Your Score
Most disappointed users are reacting to the emotional meaning they attach to the number, not the technical meaning of the number itself.
Treating 5 as failure
A 5 sits near the statistical center. It can mean your face is familiar, balanced, and easy for the model to read.
Comparing one selfie with edited photos
Social images often use lighting, lens choice, retouching, and pose. Your unedited test photo is solving a different problem.
Ignoring photo quality
A tilted head, low light, glasses, hair across the face, or a close selfie can move the score.
Reading the score as attraction in real life
The tool measures visible geometry in a still image. It cannot measure warmth, expression, voice, confidence, or chemistry.
The best use of a How Normal Am I rating is comparison: compare photo conditions, score bands, and explanations. The worst use is treating one upload as a final statement about your face.
How to Retest Before You Trust One Score
A high-impression query cluster around How Normal Am I score usually comes from users who already have a number and want to know whether it is reliable. The best answer is to test consistency, not chase a perfect score.
How to Retest Before You Trust One Score
| Retest step | Why it matters | What to do |
|---|---|---|
| Front-facing baseline | Reduces landmark distortion | Use eye-level camera and keep the full face visible |
| Lighting repeat | Controls shadows and texture changes | Use soft front light and avoid harsh backlight |
| Range check | Separates stable signals from photo noise | Compare three uploads and read the shared score band |
If two clear photos stay within about half a point, the result is probably describing a stable pattern. If the range jumps by more than one point, fix photo conditions before interpreting the score band.
Practical score check
Use the same lighting, distance, and expression for each upload. Compare the score band first, then the exact decimal number.
Tips for a More Accurate Result
If you want your score to reflect your actual facial geometry rather than photo artifacts, these adjustments make a real difference:
-
Use natural, diffused light
Soft daylight from a window in front of you is ideal. Avoid overhead lighting (creates harsh shadows under eyes and nose), direct flash (flattens features), and dim environments (forces the AI to work with noisy image data). -
Shoot straight-on at eye level
Even a slight upward or downward angle distorts facial proportions. Hold your phone at eye level, look directly into the lens, and keep your head level — no tilting. -
Use a neutral expression
A relaxed, natural expression gives the AI the clearest read on your actual proportions. Big smiles, raised eyebrows, or squinting all shift facial geometry temporarily. -
Clear your face
Remove glasses, pull hair away from your face, and avoid hats or anything that partially covers your features. The AI needs to see your full face from hairline to chin. -
Use a high-resolution photo
Modern smartphone cameras are more than sufficient. Avoid screenshots of screenshots, heavily compressed images, or photos taken in very low light. -
Test multiple photos
Take three to five photos under the same conditions and note the range. Your "true" score is closer to the average of those results than any single reading.
What the Score Cannot Tell You
I'd be doing you a disservice if I only explained what the score measures without being equally clear about what it misses.
The How Normal Am I score is a measurement of static facial geometry in a single photograph. It cannot account for:
- How you look when you're animated, laughing, or engaged in conversation
- The warmth or coldness that comes through in your eyes
- Confidence and how you carry yourself
- Voice, presence, and charisma
- Cultural context — beauty standards vary significantly across regions and communities
- Grooming, style, and presentation choices that dramatically affect real-world perception
- The personality traits that make someone genuinely magnetic
Research in social psychology consistently shows that initial physical attractiveness ratings change significantly once people interact. A face that scores a 6 on a static AI test can be experienced as a 9 by someone who's spent an hour talking with that person.
Use the score for what it's good at: understanding your facial geometry, satisfying curiosity, and having fun. Don't use it as a measure of your worth or your real-world attractiveness.
Ready to understand your own score?
Upload a clear photo, get a How Normal Am I rating, then use this guide to read the number with context.
Take the How Normal Am I TestThe Bottom Line
Your How Normal Am I score is a snapshot of how your facial geometry compares to population averages in a single photograph. A 5 is genuinely average — and average faces are consistently rated as attractive in research. A 7 is impressive. A 9 is exceptionally rare.
The number is most useful when you understand its mechanics: it measures symmetry, proportions, and feature spacing. It doesn't measure the things that make people actually attractive in real life — presence, warmth, confidence, and the indefinable quality that makes someone interesting to be around.
So take the test, enjoy the result, and then go be interesting.
Frequently Asked Questions
About the Author
Sarah Mitchell
Beauty tech journalist · 8+ years covering AI and aesthetics · Featured in TechCrunch & Wired
Sarah has been covering the intersection of beauty and technology since 2017. Her work has appeared in TechCrunch, Wired, and The Verge. She holds a degree in Computer Science and is passionate about making AI tools accessible and understandable to everyone.
References & Further Reading
- Langlois, J. H., & Roggman, L. A. (1990). Attractive faces are only average. Psychological Science, 1(2), 115–121.
- Perrett, D. I., et al. (1999). Symmetry and human facial attractiveness. Evolution and Human Behavior, 20(5), 295–307.
- New 'Golden' Ratios for Facial Beauty — National Center for Biotechnology Information (PMC2814183) — https://pmc.ncbi.nlm.nih.gov/articles/PMC2814183/
- Physical attractiveness — Wikipedia overview of research on facial attractiveness, symmetry, and the averageness effect — https://en.wikipedia.org/wiki/Physical_attractiveness
- How AI Attractiveness Tests Work: A Deep Dive into Facial Symmetry Scoring — BeautyTechInsider (Guest Contribution) — https://beautytechinsider.com/how-ai-attractiveness-tests-work/
Last updated: 2026-07-04