Golden Ratio Face: How to Measure It and What It Really Means
A practical guide to 1.618, facial measurements, photo error, and the limits of turning a mathematical reference into a beauty score.

In this guide
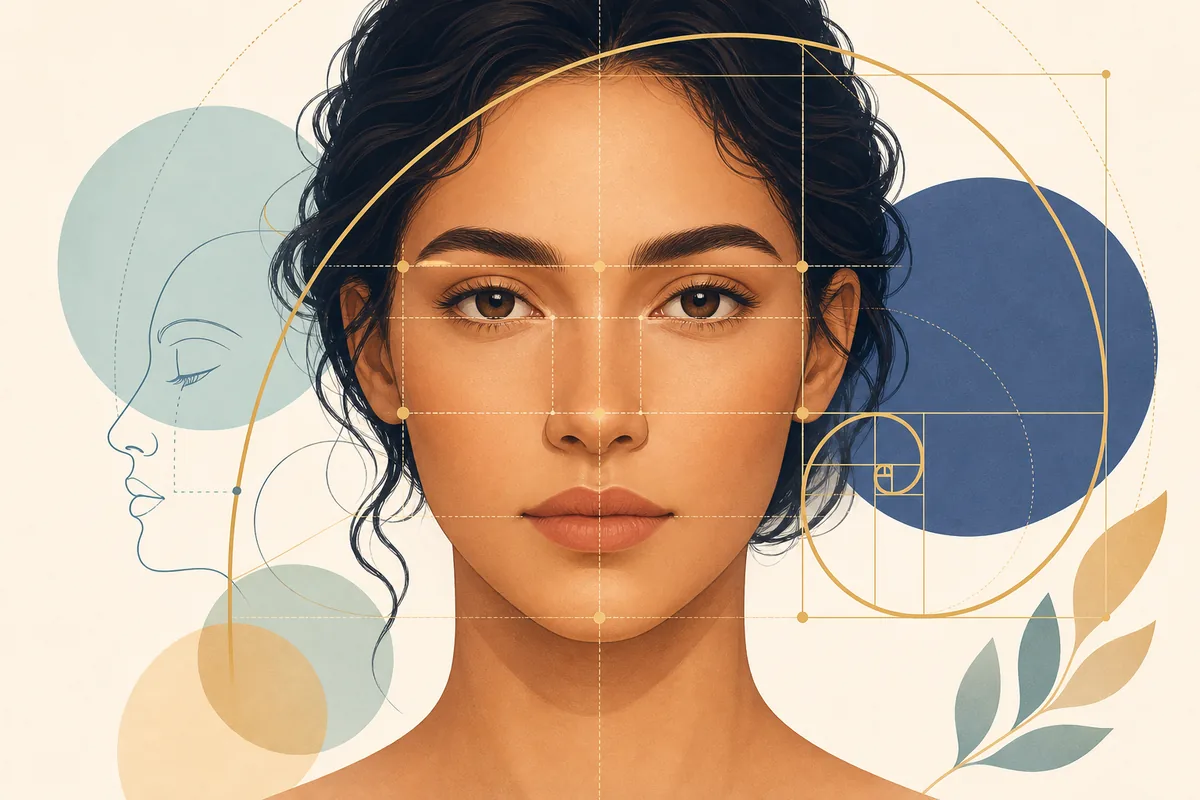
The phrase golden ratio face sounds precise because it includes a famous number: phi, written as approximately 1.618. That precision can be useful when comparing distances, but it often creates a false impression that one calculation can identify a perfect face. It cannot.
A more useful approach is to treat the ratio as one descriptive lens. Measure a consistent image, understand exactly which landmarks you used, compare more than one proportion, and keep the result separate from a judgment about attractiveness.
What does golden ratio face mean?
The golden ratio describes a relationship between two lengths. The longer length divided by the shorter is about 1.618, and the combined length divided by the longer gives the same value. The relationship appears in mathematics and has been used in art and design. Applying it to a face means selecting two visible distances and checking how close their quotient is to phi.
There is no single universally accepted golden ratio face test. One page may use overall face length divided by cheekbone width. Another may compare mouth width with nose width, parts of the lower face, eye spacing, or a geometric mask. Some tools also mix in equal facial thirds and left-right symmetry even though those are different concepts.
That difference in methods matters. Two calculators can give different scores for the same photograph without either having a software error; they may use different landmarks, weights, tolerances, or definitions of the target ratio.
A framework, not a verdict
A ratio answers a narrow question about two distances. It does not measure personality, expression, health, cultural preference, or the full impression of a face.
Which facial measurements are compared?
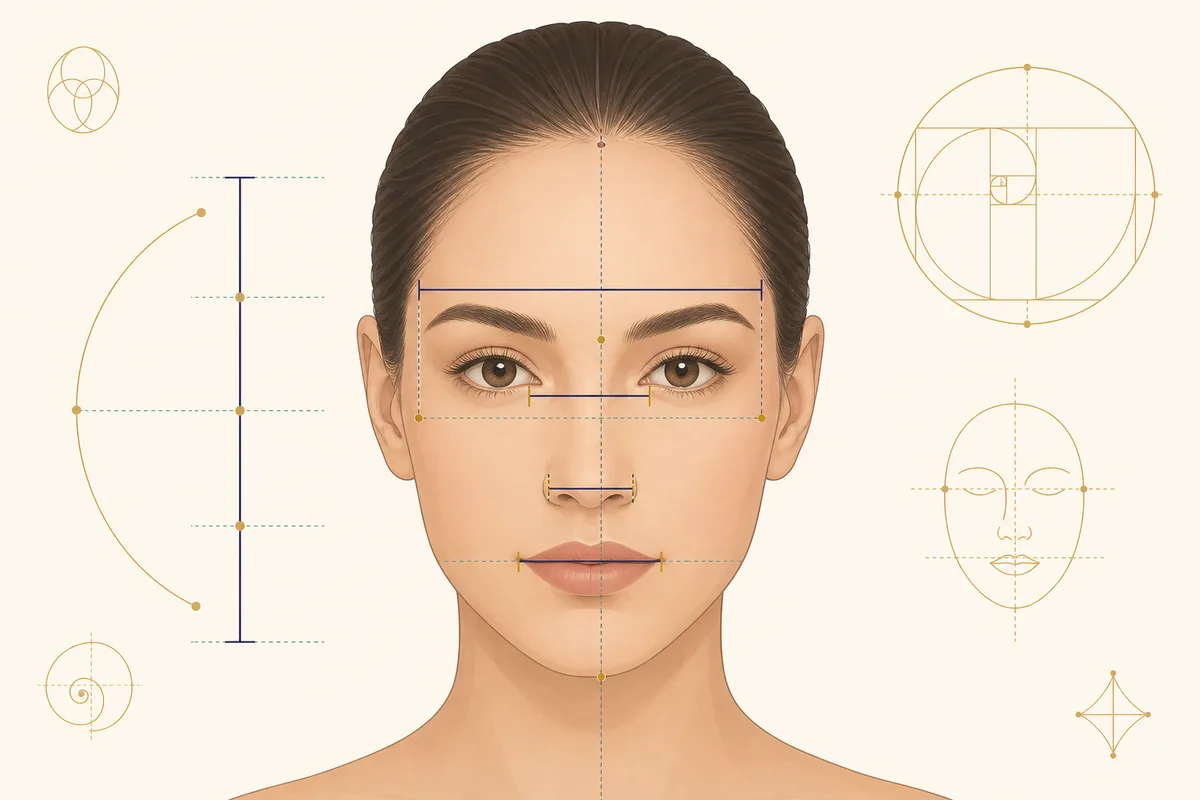
Start by naming the exact pair of landmarks. Vague instructions such as “measure the face” are not repeatable. Hairline visibility, the widest cheekbone point, the base of the nose, lip posture, and the bottom of the chin must be defined consistently.
The table below separates common checks. Values described as ideal are conventions used by particular proportion systems, not medical standards or universal population averages.
| Comparison | How it is calculated | Main source of error |
|---|---|---|
| Overall face ratio | Visible hairline-to-chin length ÷ widest cheekbone width | Hairline, head tilt, close camera |
| Mouth-to-nose width | Relaxed mouth width ÷ outer nostril width | Expression, perspective, landmark choice |
| Lower-face ratio | Selected nose-to-lip distance ÷ lip-to-chin distance | Lip posture and unclear midpoint |
| Eye spacing | One eye width compared with the gap between the eyes | Head turn and eyelid landmark choice |
| Facial thirds | Hairline-to-brow, brow-to-nose, nose-to-chin | This is an equal-thirds guide, not phi itself |
Prepare a reliable photo before measuring
Use a front-facing photo taken at eye level with a neutral expression. Pull hair away from the visible hairline, keep both ears similarly visible, look straight at the camera, and avoid raising or lowering the chin. Soft, even light helps you identify edges without deep shadows.
Distance matters more than most people expect. A close wide-angle selfie exaggerates the center of the face and can change apparent nose width, cheek width, and midface length. Move the camera farther away and use modest zoom when possible. Do not compare a phone selfie with a portrait taken by a longer lens as if both were the same measurement setup.
Use pixels rather than converting to centimeters. Ratios are unitless, so a clear image editor or ruler overlay is enough. What matters is that every point is marked on the same unwarped image.
How to measure your golden ratio face step by step
Begin with the overall ratio because it is the easiest to repeat. Then add two or three component comparisons rather than combining many uncertain landmarks into one impressive-looking percentage.
-
Mark face length
Draw a vertical center line from the visible midpoint of the hairline to the lowest point of the chin. Record the pixel distance. -
Mark face width
Measure horizontally between the widest visible cheekbone points. Keep the line level and avoid hair or ears. -
Divide length by width
For example, 720 pixels ÷ 460 pixels equals about 1.57. That is a geometric result, not a 57% or 97% beauty score. -
Add component ratios
Measure relaxed mouth width and nose width, or compare eye width with the inter-eye gap. Write down each result separately. -
Repeat the photograph
Take a second image with the same setup. If the numbers change substantially, photo conditions are dominating the result.
How to interpret a golden face ratio result
Closeness to 1.618 only says that a selected pair of distances resembles that reference. A result of 1.57 is not automatically worse than 1.62, and a result of 1.70 does not identify a defect. Measurement uncertainty can be larger than the difference you are comparing.
Avoid turning several ratios into a single percentage unless the method explains its landmarks, tolerances, and weights. A reported score such as 88% can hide whether one stable measurement or ten noisy measurements created the total. The component results are usually more informative than the headline number.
If you use an AI face analysis, compare its explanation with the image you supplied. A useful report should acknowledge pose, lighting, expression, occlusion, and camera perspective. It should not claim that a mathematical score proves how other people will see you.
Read the range, not a rank
Repeatable photo conditions and transparent component measurements are more useful than chasing a perfect percentage.
Golden ratio face vs. facial thirds, symmetry, and averageness
These terms often appear together in face-analysis results, but they answer different questions. Keeping them separate prevents one broad “harmony” score from sounding more objective than it is.
| Concept | Question it answers | What it cannot prove |
|---|---|---|
| Golden ratio | Do selected distance pairs approach 1:1.618? | Overall attractiveness or normality |
| Facial thirds | How is vertical face height distributed? | That equal thirds are required for beauty |
| Symmetry | How similar are the visible left and right sides? | How the face looks in motion or different light |
| Averageness | How close are features to a population composite? | A universal ideal across people and cultures |
| Face shape | How do forehead, cheekbones, jaw, and length form an outline? | A beauty ranking |
What research says about the golden ratio and beauty
The golden ratio remains popular because it turns a complex visual judgment into understandable geometry. Research does support studying facial proportions, symmetry, and average configurations, but that is not the same as proving that phi is a universal law of facial beauty.
Reviews of natural facial proportions have found that many measured relationships do not consistently equal the golden ratio. Attractiveness ratings also vary with population, age, sex-related traits, expression, familiarity, culture, and the observer. A single template therefore loses information that matters in real perception.
The cautious conclusion is not that proportions are meaningless. It is that phi should be used as one comparison among several, with transparent measurements and realistic uncertainty. Distinctive features can be attractive, and a face can appear harmonious without matching a geometric mask.

Common golden ratio face measurement mistakes
The most common errors are measuring a close selfie, tilting the head, hiding the hairline, using hair or ears as the face edge, measuring a smiling mouth, and mixing landmarks from different diagrams. Rounding too early can also exaggerate a tiny difference.
Do not compare a mirror image, a filtered social photo, and an identification photo as if they were interchangeable. Filters may reshape the jaw, eyes, nose, or skin boundary. Even unfiltered images can be mirrored or corrected by phone software.
Finally, do not use an online ratio to make medical, dental, or surgical decisions. Pain, bite changes, injury, rapid asymmetry, or a health concern needs an appropriate clinician. A photo guide can explain visible proportions; it cannot diagnose an underlying condition.
- Keep the camera level and farther from the face.
- Use the same landmark definitions for every image.
- Record separate ratios instead of only one total score.
- Repeat the setup before interpreting a surprising number.
- Describe differences neutrally rather than labeling them flaws.
Compare your photo with context
Use a clear front-facing image and treat AI feedback as photo-based analysis, not an objective beauty verdict.
Try the AI face testGolden ratio face FAQ
References and further reading
- The golden ratio—dispelling the myth - PubMed Central
- Evaluation of Facial Beauty Using Anthropometric Proportions - PubMed Central
- Facial Anthropometric Measurements and Principles: Overview and Implications for Aesthetic Treatments - PubMed
Related guides
Facial thirds guide
Measure upper, middle, and lower face regions without confusing equal thirds with phi.
Learn facial thirdsFace symmetry test
See how pose and photo conditions affect left-right comparisons.
Understand facial symmetryAverage face meaning
Learn why statistical averageness is different from a golden-ratio ideal.
Explore average facesLast updated: July 25, 2026
Back to the face test